
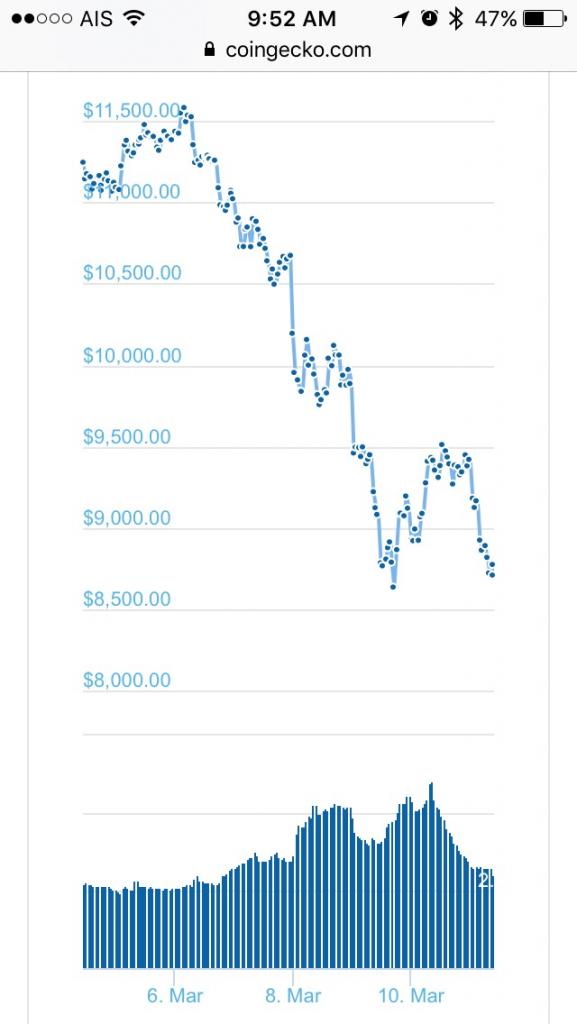
first day trade of the day: bought some btc/usdt at 8,700.
looks like a double bottom on the 7 day chart:

Results 6,326 to 6,350 of 8993
Thread: RIP Bitcoin
-
11-03-2018, 09:55 AM #6326I'm in Jail


- Join Date
- Dec 2009
- Last Online
- 06-02-2020 @ 07:44 PM
- Posts
- 2,985
-
11-03-2018, 10:26 AM #6327I'm in Jail
- Join Date
- Dec 2009
- Last Online
- 06-02-2020 @ 07:44 PM
- Posts
- 2,985
2 hour chart on binance.
if it breaks support at around 8300, i'll cut loss.
profit: will take a 5-10% gain.
-
11-03-2018, 10:32 AM #6328I am in Jail

- Join Date
- Apr 2006
- Last Online
- 23-08-2021 @ 06:47 PM
- Location
- In the Jungle of Love
- Posts
- 14,771
^What does a double bottom mean in market terms?
-
11-03-2018, 10:36 AM #6329Thailand Expat


- Join Date
- Aug 2006
- Last Online
- 18-04-2024 @ 09:18 PM
- Posts
- 1,490
so a 10% gain is sell at about 9600 without factoring in exchange costs?
Do you actually watch it or set sell points?
-
11-03-2018, 10:40 AM #6330I'm in Jail
- Join Date
- Dec 2009
- Last Online
- 06-02-2020 @ 07:44 PM
- Posts
- 2,985
https://www.investopedia.com/terms/d/doublebottom.asp Originally Posted by Mr Earl

A double bottom is a charting pattern used in technical analysis. It describes the drop of a stock or index, a rebound, another drop to the same or similar level as the original drop, and finally another rebound. The double bottom looks like the letter "W".
-
11-03-2018, 10:42 AM #6331I'm in Jail
- Join Date
- Jan 2013
- Last Online
- 20-04-2024 @ 03:45 PM
- Location
- Bungling in the jungle
- Posts
- 10,387
It's the insertion point for a candlestick.
-
11-03-2018, 10:47 AM #6332I'm in Jail
- Join Date
- Dec 2009
- Last Online
- 06-02-2020 @ 07:44 PM
- Posts
- 2,985
usually just watch it and sometimes choose a point. Originally Posted by Ukan Kizmiaz
5% profit will be when it hits 9100.
if you have bnb, the trading fee is .05% on binance (very low). Originally Posted by Ukan Kizmiaz
it's .25% on bx.in.th (5 times higher).
-
11-03-2018, 11:27 AM #6333I am in Jail
- Join Date
- Apr 2006
- Last Online
- 23-08-2021 @ 06:47 PM
- Location
- In the Jungle of Love
- Posts
- 14,771
^ Thanks, so it looks like it will blast off for the moon, hey hey.
I'll buy some more today.
-
11-03-2018, 11:32 AM #6334I'm in Jail
- Join Date
- Dec 2009
- Last Online
- 06-02-2020 @ 07:44 PM
- Posts
- 2,985
i wouldn't say that, earl. Originally Posted by Mr Earl
i'm in and out of the market quickly (day trading) since taking my initial investment out in early january after investing in december.
-
11-03-2018, 11:41 AM #6335Thailand Expat
- Join Date
- Aug 2006
- Last Online
- 18-04-2024 @ 09:18 PM
- Posts
- 1,490
yes I don't see any 'technical' indication that it is heading for the moon...heading up though for the 5% gain...
-
11-03-2018, 11:44 AM #6336Excommunicated


- Join Date
- Apr 2006
- Last Online
- Today @ 05:26 AM
- Posts
- 24,826
Originally Posted by fishlocker

the trendlines look distnctly like the classic gonads and bellend which means that after this recent move past the prince albert we are looking at a substantial drop to the hairy plums
-
11-03-2018, 12:11 PM #6337Thailand Expat

- Join Date
- Jan 2006
- Last Online
- @
- Posts
- 15,054
jesus wept. Originally Posted by Mr Earl
it truly is the blind leading the blind on here.
-
11-03-2018, 12:14 PM #6338I'm in Jail
- Join Date
- Dec 2009
- Last Online
- 06-02-2020 @ 07:44 PM
- Posts
- 2,985
are you trading cryptos, ray? Originally Posted by raycarey
or did you just stop in to say hi and see if redhaze is here?
-
11-03-2018, 12:39 PM #6339Thailand Expat

- Join Date
- Jul 2010
- Last Online
- Today @ 12:09 AM
- Location
- Where troubles melt like lemon drops
- Posts
- 25,249
^^^
At last, Charting for TD (The Dinosaurs) members. Possibly a GIF/cartoon utilising certain members would stick in their minds better.
-
11-03-2018, 12:44 PM #6340Thailand Expat
- Join Date
- Jul 2010
- Last Online
- Today @ 12:09 AM
- Location
- Where troubles melt like lemon drops
- Posts
- 25,249
They say their only here for the Craic, let them enjoy winning a few THB and losing a larger number. 'Tis just pieces of coloured paper after all. Originally Posted by raycarey
-
11-03-2018, 12:55 PM #6341I'm in Jail
- Join Date
- Jan 2013
- Last Online
- 20-04-2024 @ 03:45 PM
- Location
- Bungling in the jungle
- Posts
- 10,387

-
11-03-2018, 12:58 PM #6342I'm in Jail
- Join Date
- Jan 2013
- Last Online
- 20-04-2024 @ 03:45 PM
- Location
- Bungling in the jungle
- Posts
- 10,387
I'm looking for that pink puckered starfish.
Then I'm all in.....hook line and shanker.
fish
-
11-03-2018, 01:01 PM #6343I'm in Jail
- Join Date
- Dec 2009
- Last Online
- 06-02-2020 @ 07:44 PM
- Posts
- 2,985
at 8,800 currently. Originally Posted by Farangrakthai

-
11-03-2018, 01:21 PM #6344I'm in Jail
- Join Date
- Dec 2009
- Last Online
- 06-02-2020 @ 07:44 PM
- Posts
- 2,985
put a limit order in to sell at 9,100:
-
11-03-2018, 07:01 PM #6345Thailand Expat
- Join Date
- Aug 2006
- Last Online
- 18-04-2024 @ 09:18 PM
- Posts
- 1,490
and did you get the price? - it went close then splat!
-
11-03-2018, 07:05 PM #6346I'm in Jail
- Join Date
- Dec 2009
- Last Online
- 06-02-2020 @ 07:44 PM
- Posts
- 2,985
yep, got it. Originally Posted by Ukan Kizmiaz
was a fun ride and made a few thousand baht (6-7,000).
-
11-03-2018, 07:21 PM #6347Thailand Expat
- Join Date
- Sep 2017
- Last Online
- 26-03-2019 @ 11:28 AM
- Location
- across the street
- Posts
- 4,083
Buy,HODL and fuhgeddabout da mkt cap.
-
11-03-2018, 07:22 PM #6348Thailand Expat
- Join Date
- Aug 2006
- Last Online
- 18-04-2024 @ 09:18 PM
- Posts
- 1,490
^^ cool - when I did a bit of trading it was always tempting to hang in for a little more - and then (ineviatably) get screwed when it turned fast.
Its easy to forget that 5% gain over a few hours is fantastic - unless you're at the casino or racetrack.
-
11-03-2018, 07:22 PM #6349I'm in Jail
- Join Date
- Dec 2009
- Last Online
- 06-02-2020 @ 07:44 PM
- Posts
- 2,985
nice looking double bottom on the 14 day chart!
-
11-03-2018, 07:24 PM #6350I'm in Jail
- Join Date
- Dec 2009
- Last Online
- 06-02-2020 @ 07:44 PM
- Posts
- 2,985
Yep, i'm happy with it and it adds up, if you do that a few times/week. Originally Posted by Ukan Kizmiaz

 Reply With Quote
Thread Information
Users Browsing this Thread
There are currently 16 users browsing this thread. (0 members and 16 guests)
