
^
If that's what gets you through your day.....
Originally Posted by NM

Results 751 to 764 of 764
-
06-10-2011, 01:01 PM #751Thailand Expat


- Join Date
- Jan 2011
- Last Online
- @
- Location
- A "non-existent" Thai PsyOps unit
- Posts
- 4,550
-
06-10-2011, 01:38 PM #752Thailand Expat
- Join Date
- Jan 2011
- Last Online
- @
- Location
- A "non-existent" Thai PsyOps unit
- Posts
- 4,550
From the blog world.....
Analysis of the 2011 Thai Election Part 4: Constituency Vote | Asian Correspondent
By Bangkok Pundit
Oct 06, 2011
This is the fourth post in a multi-part series of posts on the July 3, 2011 Thai general election. The first post looked at the nationwide party-list vote totals for each of the political parties. The second post analyzed the party-list by the different regions for each of the parties. The third post compared the party-list vote of each of the parties for the 2007 and 2011 general elections.
This post will look at the constituency vote for the 2011 general election, but also compare with the 2007 general election.
First, the 2007 general election. Nationwide:

Source: Based on a spreadsheet downloaded from the ECT in this ZIP file. BP has uploaded a spreadsheet of the page here.*
Second, the 2011 general election:

Source for 2011 general election statistics is this PDF file.
BP: Okay, it is clear that Puea Thai did much better than PPP (the previous pro-Thaksin party) going from 36.83% to 44.94%, but the Democrats also increased their vote total from 30.21% to 31.92%. It was that votes for third parties dropped significantly from 32.96% to 23.14%. Thailand is moving more and more to a two-party system. For the Democrats, that is bad news because they are unable to win a majority on their own. They need stronger third parties to win seats of Puea Thai in various constituencies throughout the country.

BP: Visually, this shows you what happened with the collapse of the third party vote being most noticeable in the Central, North and Northeast regions.
NOTE: Thanks to Chris Baker for providing his spreadsheet data. Idea for the chart also shamelessly borrowed from Chris as well.
*At the 2007 general election, voters could vote for 2 or 3 candidates (depending on which constituency they lived in) so overall there were 72 million votes cast..
.....the world will little note nor long remember what we say here....."
-
06-10-2011, 10:04 PM #753Twitter #BKKTS


- Join Date
- Sep 2009
- Last Online
- 27-08-2023 @ 10:33 AM
- Posts
- 9,222
Has anyone found a list (in English) of the names of all the elected MPs, their constituencies and their party affiliations? I haven't been able to find one. Thanks if you can post a link. BP - maybe that's your next assignment.. Why? Because let's examine the family names.
My mind is not for rent to any God or Government, There's no hope for your discontent - the changes are permanent!
-
06-10-2011, 10:36 PM #754Thailand Expat
- Join Date
- Jan 2011
- Last Online
- @
- Location
- A "non-existent" Thai PsyOps unit
- Posts
- 4,550
^
Try Human Resource
Constituencies not mentioned - nor list vs constituency MP separation.
-
07-10-2011, 12:56 PM #755Thailand Expat
- Join Date
- Dec 2006
- Last Online
- 19-10-2023 @ 10:19 PM
- Location
- Bangkok Thailand
- Posts
- 2,231
We finally got the all vote totals and here's a summary

TH
-
07-10-2011, 01:12 PM #756Thailand Expat
- Join Date
- Jan 2011
- Last Online
- @
- Location
- A "non-existent" Thai PsyOps unit
- Posts
- 4,550
^
Not to even mention the 25-ish% of eligibles who didn't vote at all.
Crikey, chaps - it's almost a dictatorship.....")
-
07-10-2011, 02:13 PM #757Thailand Expat

- Join Date
- Feb 2006
- Last Online
- @
- Posts
- 38,456
^^ There is also the 'not so small' matter of 2mm spoiled votes, and 1.4mm vote 'No's, which reduces the total number of votes cast by almost 10%- to 31,760,968. You have conveniently lumped these in with 'did not vote for PT'. They did not vote for anybody. Did you serve an apprenticeship with Fox News?
-
07-10-2011, 02:44 PM #758I'm in Jail


- Join Date
- Mar 2006
- Last Online
- 12-06-2021 @ 11:13 PM
- Posts
- 39,832
so PTP is a popular minority after all ? make sense for a fascist group,
-
07-10-2011, 03:53 PM #759Thailand Expat
- Join Date
- Dec 2006
- Last Online
- 19-10-2023 @ 10:19 PM
- Location
- Bangkok Thailand
- Posts
- 2,231
Originally Posted by sabang

I will agree that for the spolied votes we don't know who they voted for, but the "no" votes for sure did not vote for PTP. Makes the percentage somewhere just above 45% that voted for PT.
TH
-
07-10-2011, 04:18 PM #760Member

- Join Date
- Nov 2009
- Last Online
- Today @ 09:01 PM
- Location
- Bangkok
- Posts
- 34,363
Or any other political party. Originally Posted by Thaihome
You are a deluded nest of misinformation, TH...
-
07-10-2011, 04:29 PM #761Thailand Expat

- Join Date
- Jun 2010
- Last Online
- 22-02-2012 @ 03:37 PM
- Location
- Phnom Penh
- Posts
- 1,643
PT is the biggest party. And they have a majority in parliament. That's proportional election for you.
They'd have had the majority in a majority election as well.
-
07-10-2011, 04:53 PM #762Thailand Expat


- Join Date
- Nov 2008
- Last Online
- Today @ 11:31 PM
- Location
- Berlin Germany
- Posts
- 7,070
What was the highest percentage of the vote for any British PM in the last 40 years? Originally Posted by Thaihome
I am quite sure, none of them came to 45%.
-
08-10-2011, 12:01 PM #763Twitter #BKKTS
- Join Date
- Sep 2009
- Last Online
- 27-08-2023 @ 10:33 AM
- Posts
- 9,222
Thanks! Originally Posted by SteveCM
-
08-10-2011, 01:28 PM #764Thailand Expat
- Join Date
- Jan 2011
- Last Online
- @
- Location
- A "non-existent" Thai PsyOps unit
- Posts
- 4,550
Fairly sure you're right - it's almost a given with First-Past-The-Post (FPTP) and a 3-party (OK, 2.5-party) system combined. Originally Posted by Takeovers
...
In the 1997 election, the victorious Labour Party gained 43.2% of the total votes cast and won 63.6% of seats at Westminster. The combined number of votes for the Tory and Liberal Democrats represented 47.5% of the total votes (nearly 4% more than Labour) yet between them they got 32.1% of the seats available at Westminster.
In the 2001 election, Labour got 43% of the total popular vote whereas all the other parties got 57% - yet Labour maintained its very powerful position in Parliament with 413 MP's out of 659. The same trend was seen with the 2005 election result.
It can be claimed that such a percentage of votes should not have given Labour such large Parliamentary majorities – but the workings of the FPTP system allows for just such an occurrence. In fact, no government since 1935 has had a majority of public support as expressed through votes cast at a national election.
...
First Past the Post


 Reply With Quote
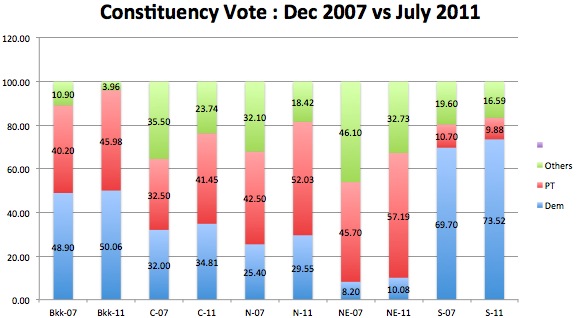
Thread Information
Users Browsing this Thread
There are currently 1 users browsing this thread. (0 members and 1 guests)
